
From a live deployment
"Which routes carry the biggest fare gap between last-minute and advance bookings, and what is it costing us?"
Analysis
Copy

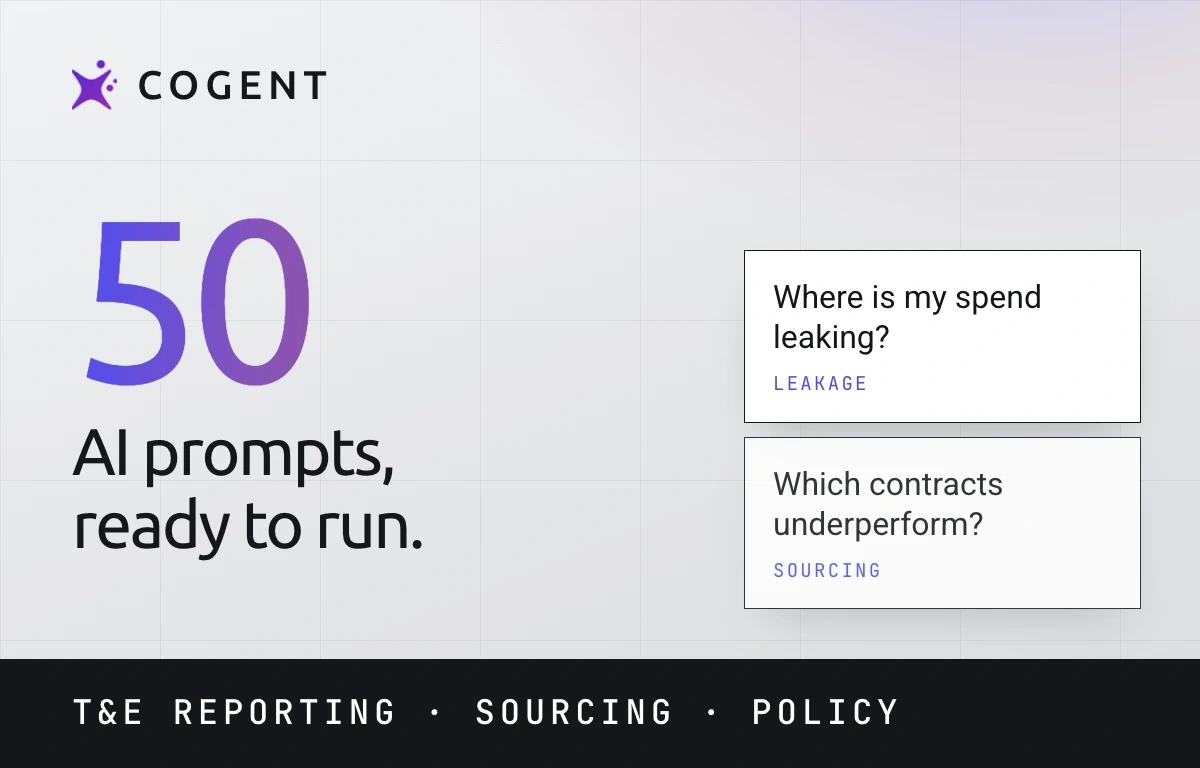
The Cogent prompt library is 50 free AI prompts for travel and expense: ready-to-run AI prompt examples drawn from live enterprise deployments and written the way you would brief an analyst in natural language. This is not an AI prompt generator. Every brief is already written and tested, so you copy one, run it in Cogent on your own data, and the cited answer comes back in seconds. Use them as prompt templates and change the scope, entity or period to fit your own programme.

The best AI prompts are the ones already proven on real programme data. Treat this as your AI prompt cheat sheet for the first week.
Copy any prompt verbatim, or use it as a template. Each is written as a complete brief: scope, timeframe, output.
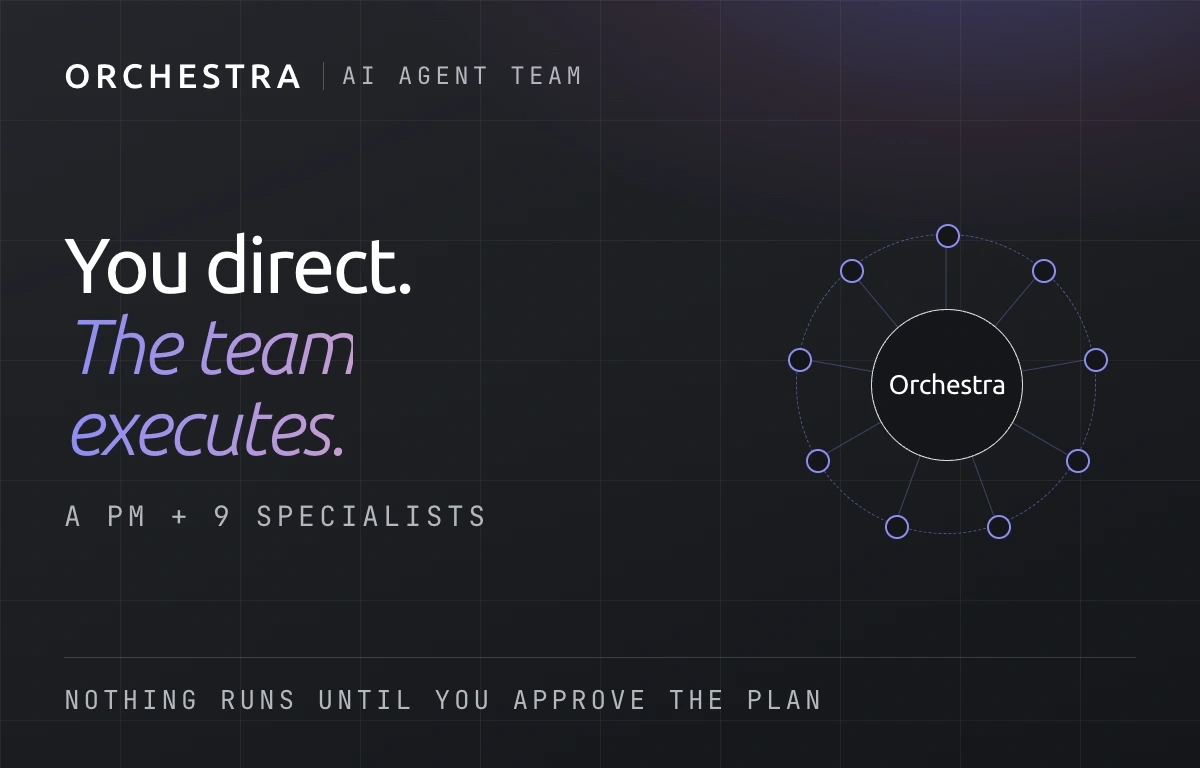
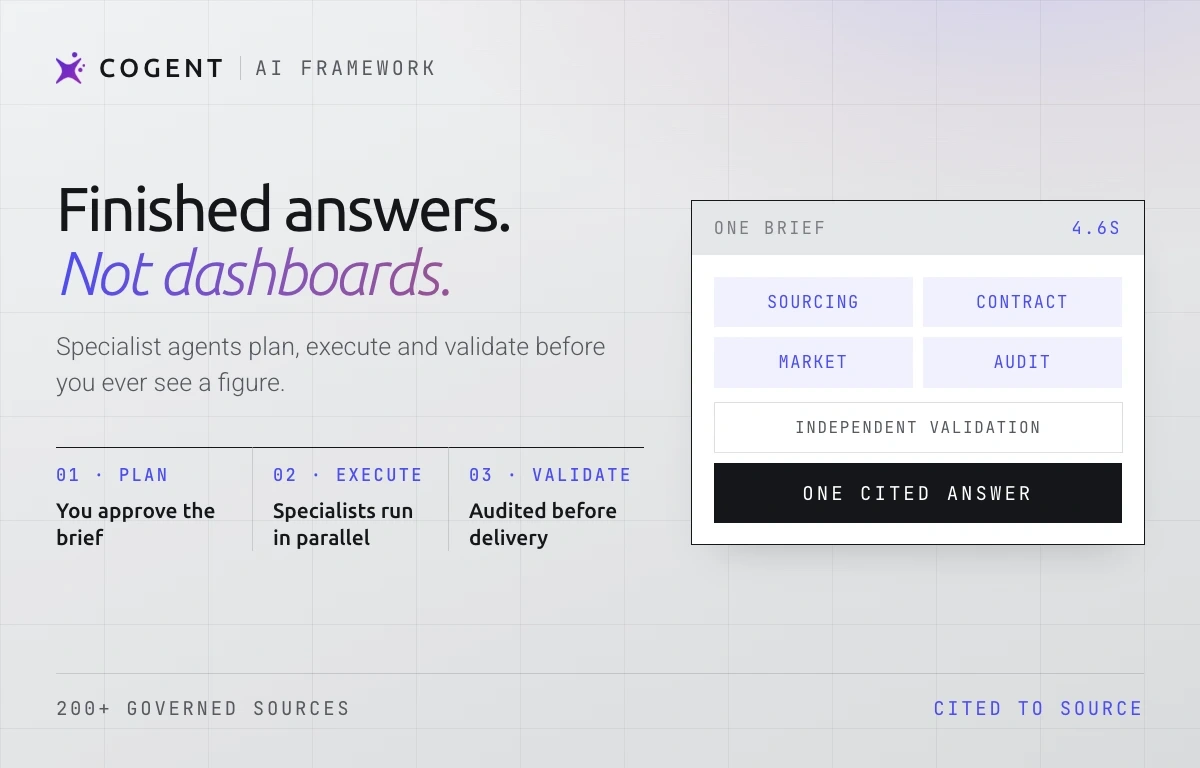
Run it in Cogent. Agentic AI plans the work, puts specialist agents on it across your live T&E data in real-time, and returns a validated, cited answer in seconds.
Ask again whenever the data moves; every run executes on fresh, consolidated data.
Swap the timeframe, region or threshold; the brief structure stays the same, which is what makes these AI prompt templates rather than one-off questions.
"Being able to chat with an AI is not the same as transacting business with one. The library closes that gap: every brief here has already run inside a real programme, so your first question works like an expert's."
.png)
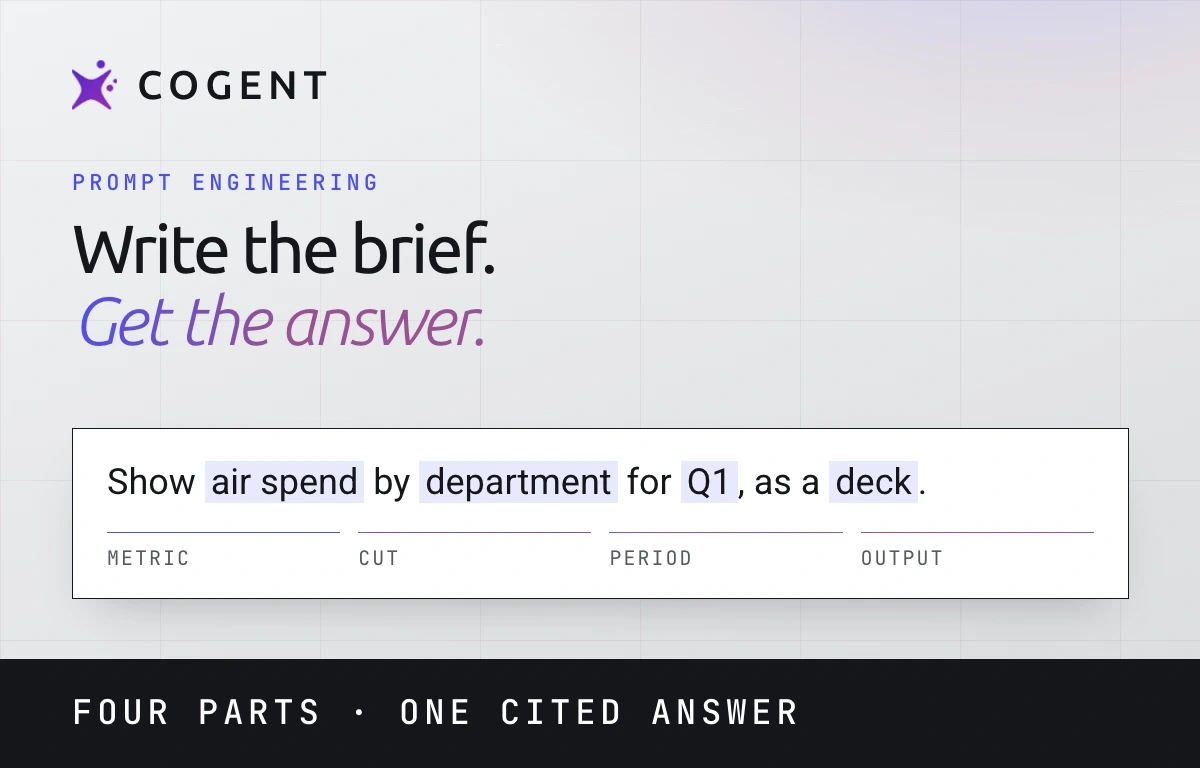
Every prompt on this page follows the same three-part shape, which is why every prompt on this page works. That shape is the whole of prompt writing for T&E: scope, timeframe, output. Explainable by design: the reasoning comes back with the figure, so you can check the shape before you trust the answer. Want the full method? The PredictX guide to prompt engineering for T&E management covers the structures, the patterns and the worked examples.
What comes back: Contract positions, market benchmarks and negotiation briefs built from your own data.
"Which routes have drifted off our negotiated carrier agreement this quarter, and at what premium?"

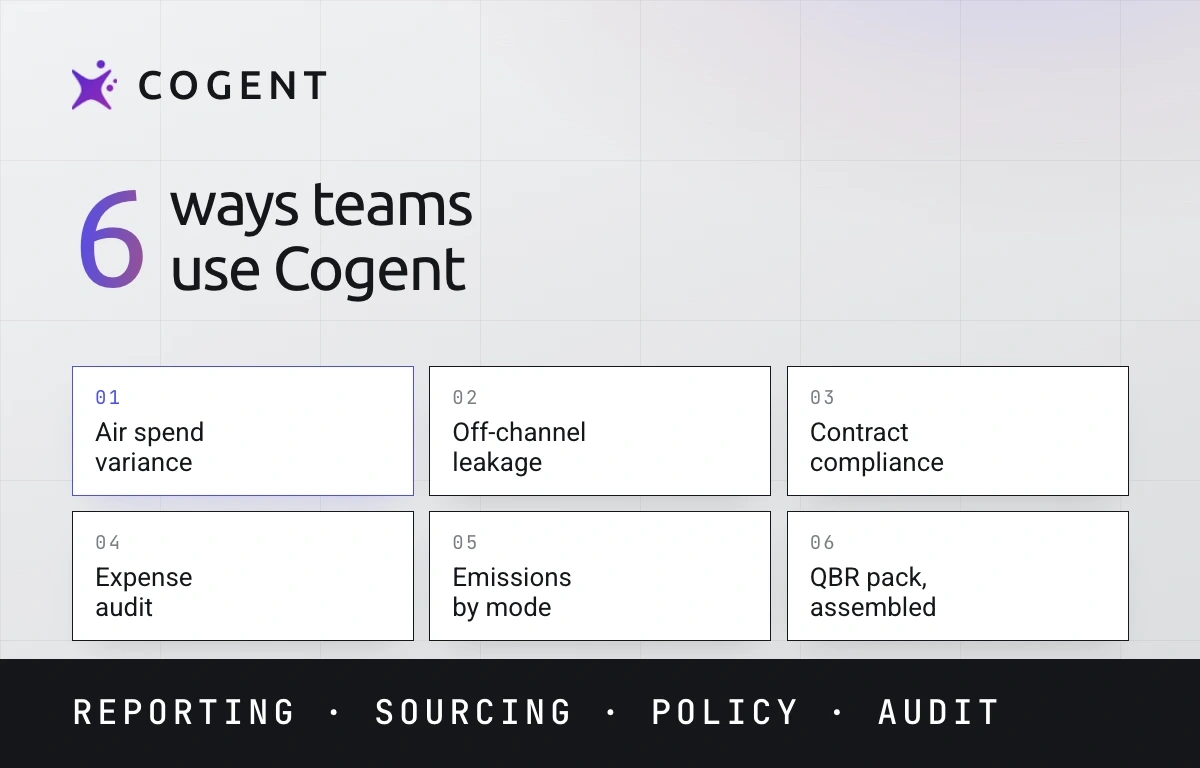
"Which routes carry the biggest fare gap between last-minute and advance bookings, and what is it costing us?"
"Compare our average ticket price against the market median on our top 20 routes, split by carrier, to identify overpayment."
"List our live versus expired airline agreements with discount terms and expiry dates, and flag immediate renewal priorities."
"Compare the total cost of ownership across all three RFP submissions, including implementation, licensing and variable fees projected over 3 years."
What comes back: Attachment gaps, rate-parity failures and the off-channel spend your system never saw.
"Show me all international flights in Q1 where no corresponding hotel was booked in our system."

"How many room nights last quarter were in scope for a one-class hotel trade-down, and what would it have saved?"
"Identify the top 10 non-preferred properties by spend across our top cities for immediate negotiation or redirection."
"Audit every booked stay in Q2 against the contracted rate and rank properties by rate parity failure."
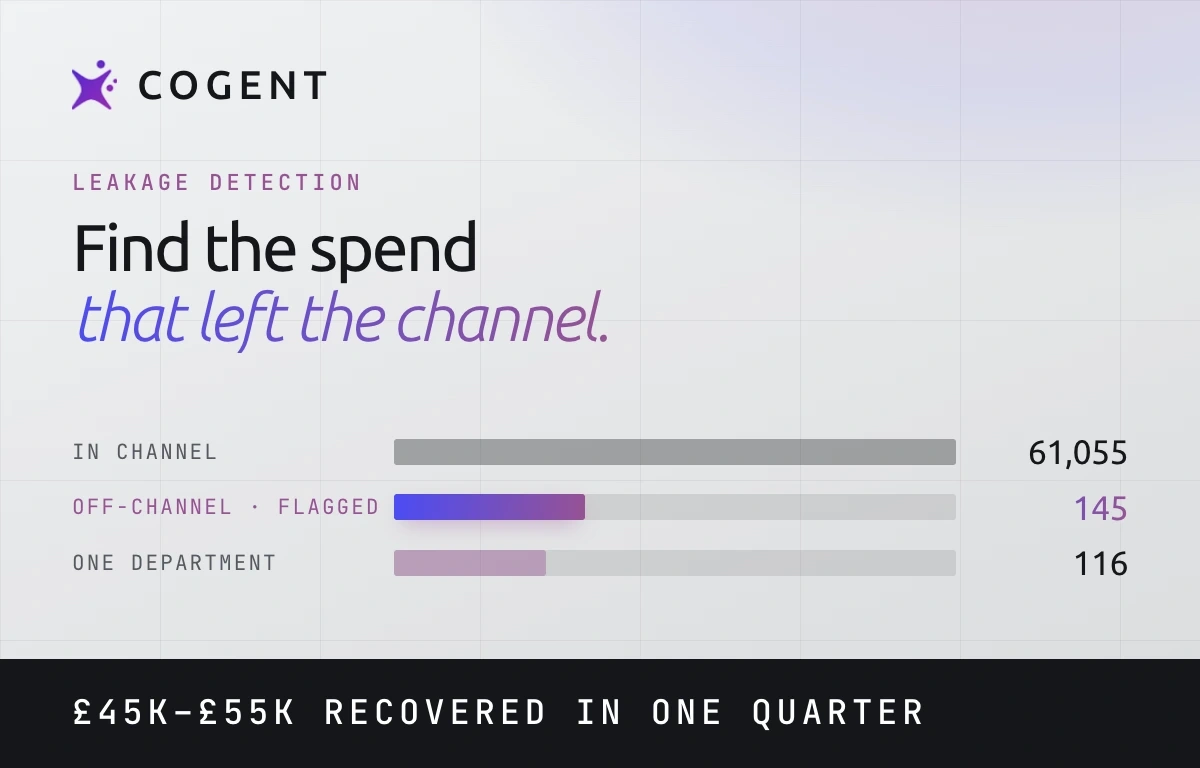
"Calculate the total estimated cost of off-channel hotel bookings in EMEA last year and show which departments drive the most leakage."
What comes back: The drivers behind every increase, trip analytics down to the individual journey, and leakage surfaced with an action plan attached.
"Identify the top 3 cost centres where travel spend increased more than 15% year on year and show the primary driver behind each increase."

"Find every unused ticket credit expiring in the next 90 days, by entity."
"Break down total trip cost for our top 10 travellers: air, hotel, ground and ancillary."
"What percentage of our travellers drive half of our total travel spend?"
"Show rail versus air spend on short-haul routes where both exist, and estimate the shift saving."
What comes back: Scenario modelling of policy impact before you commit, tested against real bookings in the policy simulation workflow.
"How many trips of two days or less did we take last quarter, and what did they cost by business unit?"

"Model a £50 increase to the daily meal allowance (per diem) across EMEA: total cost impact and affected travellers."
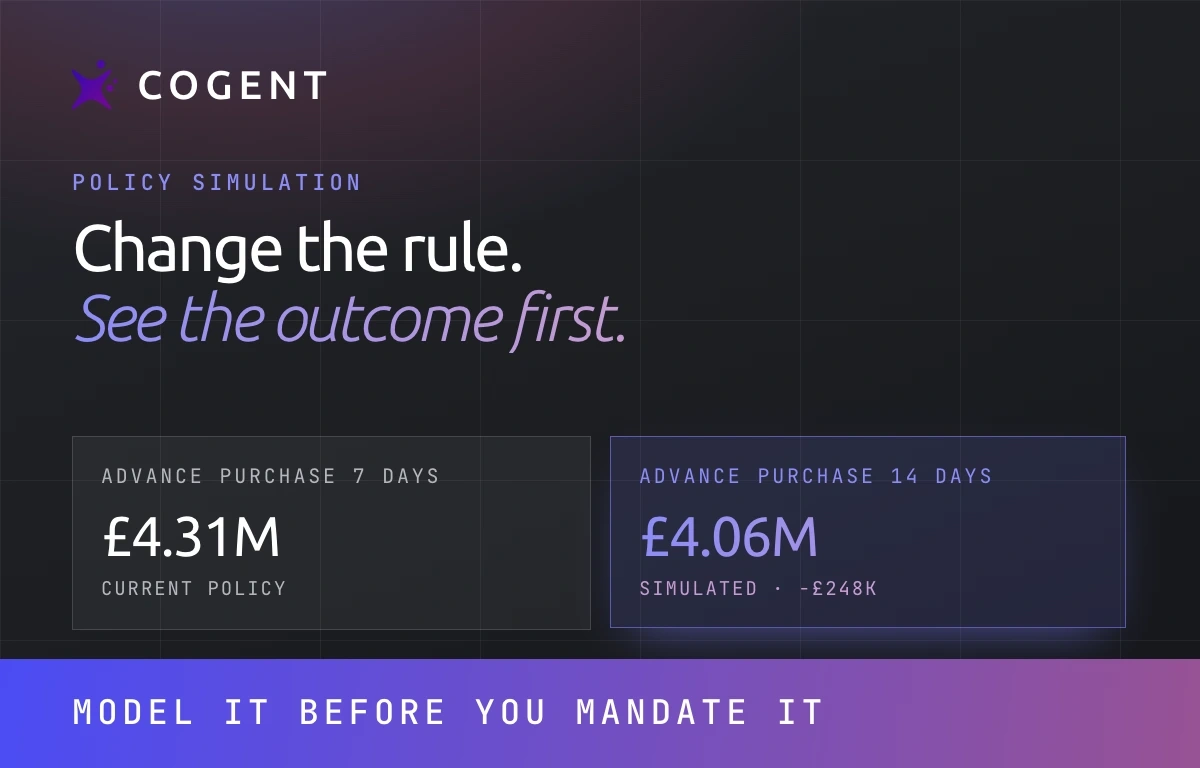
"Model the compliance impact of a 21-day advance purchase policy across all markets and show how behaviour differs by region."
"Test business-class threshold changes in one-hour increments to find the optimal balance of savings versus traveller disruption."
"Rank our top 5 policy leaks by savings potential and show the traveller-friction impact of fixing each."
What comes back: Continuous monitoring of breaches by named traveller, behavioural patterns behind the numbers, and fraud caught before reimbursement.
"Show all travellers who submitted expense claims within 48 hours of a cancelled trip last quarter and flag any with no corresponding TMC record."

"Identify all corporate card transactions in Q2 on weekends in non-travel locations and cross-reference against submitted expense reports."
"What share of tickets booked inside 14 days carries a recorded reason code, and where are the gaps?"
"Flag expense claims with duplicate, altered or missing receipts against card records."
"Which departments show the fastest-growing out-of-policy spend, and what behaviour drives it?"
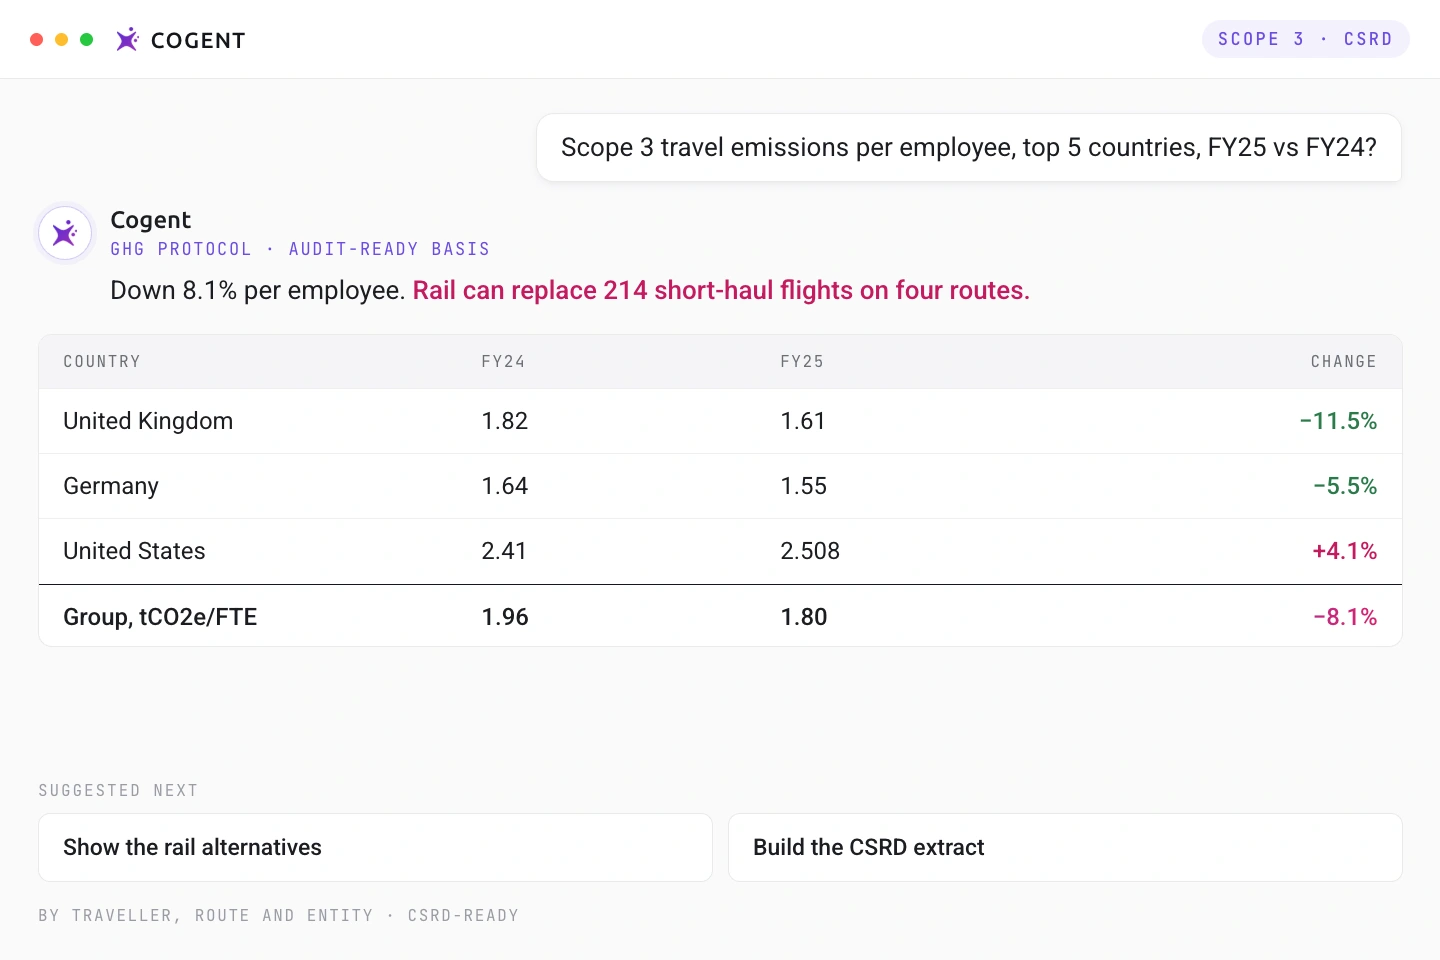
What comes back: Audit-ready Scope 3 reporting by traveller, route and entity, with the reduction options modelled.
"Compare our Scope 3 travel emissions per employee across our top 5 operating countries for FY25 versus FY24."
"Show which of our top 10 air routes has the highest CO2 per passenger kilometre and identify the rail alternative with the lowest emissions for each."
"Build the CSRD-ready quarterly emissions report by entity, route and traveller segment."
"Rank our markets by emissions intensity per trip and flag where modal shift would cut the most CO2."
"Estimate the emissions impact of shifting our top 5 domestic air routes to rail."
What comes back: Forecasts and variance built from live bookings, drillable to entity level.
"Forecast travel spend for the next 12 months using current bookings and seasonal patterns."

"Show period-accurate variance by cost centre for Q2, decomposed into volume, price and mix."
"Reconcile booked versus expensed spend for last month and list the largest accrual gaps."
"Which departments will exceed their annual travel budget at the current run rate, and when?"
"Compare year-to-date air KPIs against the prior 12-month period to establish momentum."
What comes back: Board-ready packs with every figure cited, in the format the meeting needs.
"Build the Q3 travel programme review pack: spend, compliance, supplier performance, with citations."
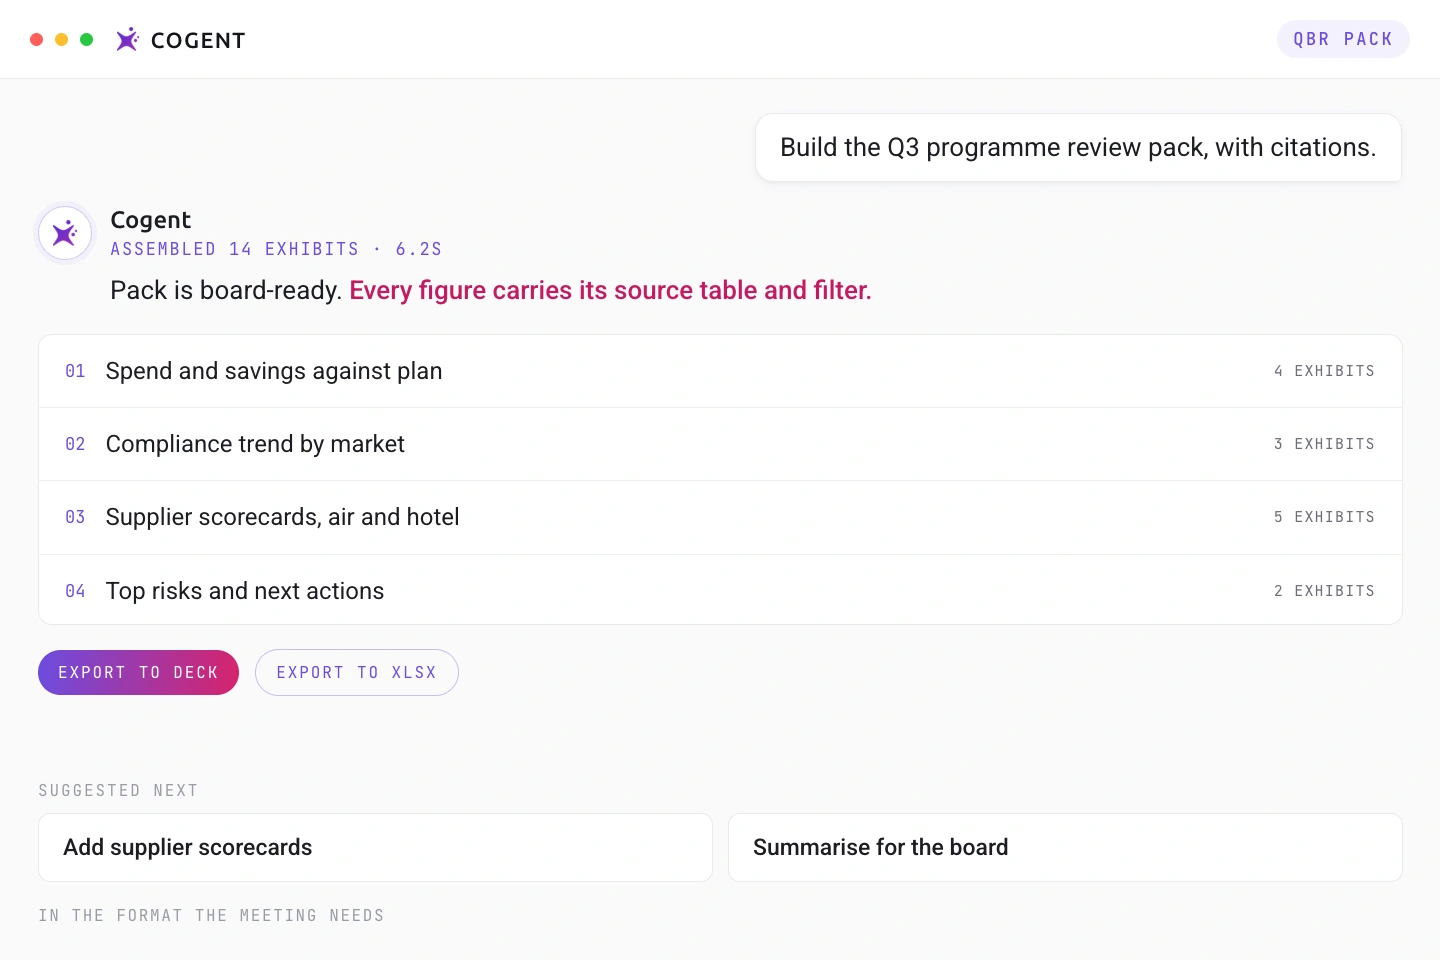
"Summarise this quarter's programme performance for the board: savings achieved, compliance trend, top risks, next actions."
"How much spend sits against unassigned or unknown business units, and where does it come from?"
"Which suppliers underperformed their contract terms this quarter, and what is the commercial impact?"
"Produce a one-page country-level breakdown of Q1 travel spend for the CFO, exportable to PowerPoint."
What comes back: Traveller exposure, disruption impact and pre-trip duty-of-care reports, built from live itineraries.
"Show every traveller currently in, or booked to travel to, a high-risk destination in the next 14 days, with itineraries."

"List the trips affected by disruption on our top routes this week and rank rebooking urgency by meeting date."
"Produce the pre-trip report for next week: who is travelling, where, on which carriers, with duty-of-care flags."
"Identify itineraries with no hotel or ground arrangements on file for overnight stays."
"Show our exposure by country: traveller nights, spend and single-carrier dependency for the last 12 months."
What comes back: Channel mix, modal shift, rail and rideshare patterns, and the reconciliation between what was booked and what was expensed.
"Break down ground transport spend by rideshare, taxi and rail for the last 12 months, split by expense claims versus TMC bookings."

"Reconcile booking channel mix by market: online booking tool versus agent versus off-channel, with the cost differential."
"Identify travellers who consistently expense rideshare above the city median and quantify the gap."
"Show first-class and premium rail bookings against policy thresholds, by business unit."
"Which cities show the highest ground transport cost per trip, and what channel mix drives it?"
Several of the briefs on this page have a track record. The prompts are reproduced here unchanged, and the outcomes below came from running them on live, consolidated enterprise data.
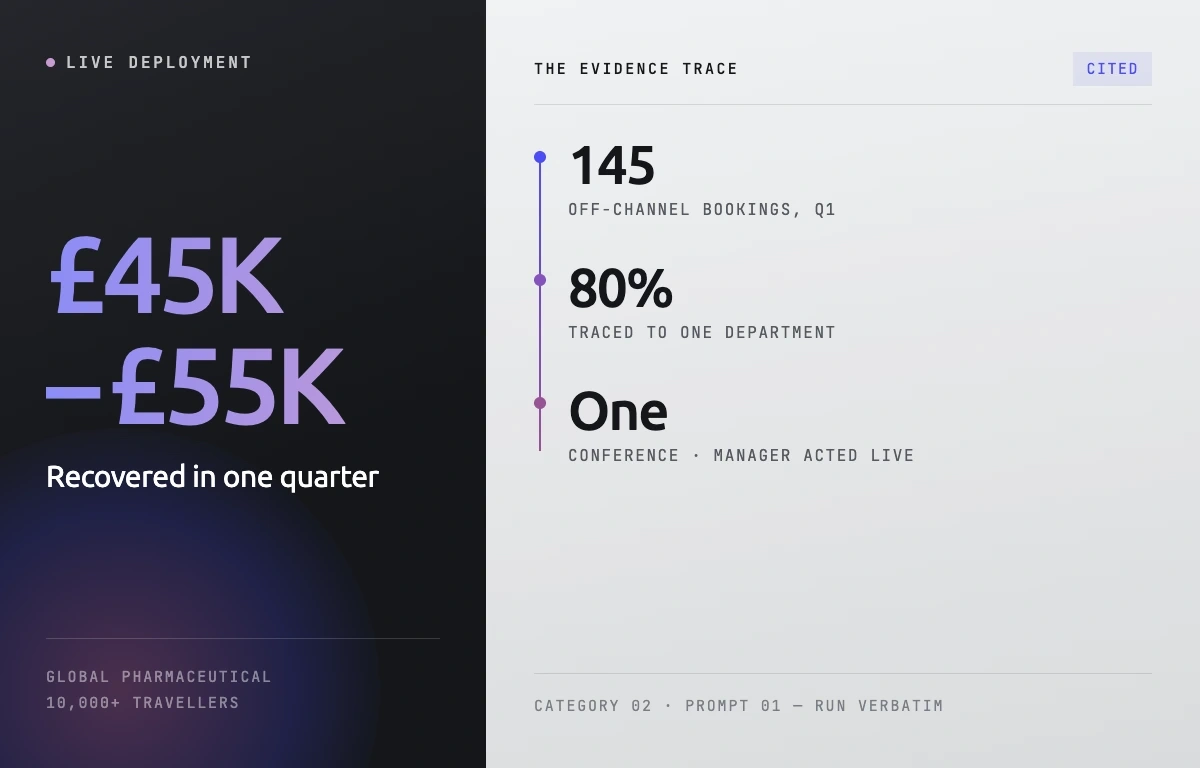
Live deployment · Category 02 · prompt 01
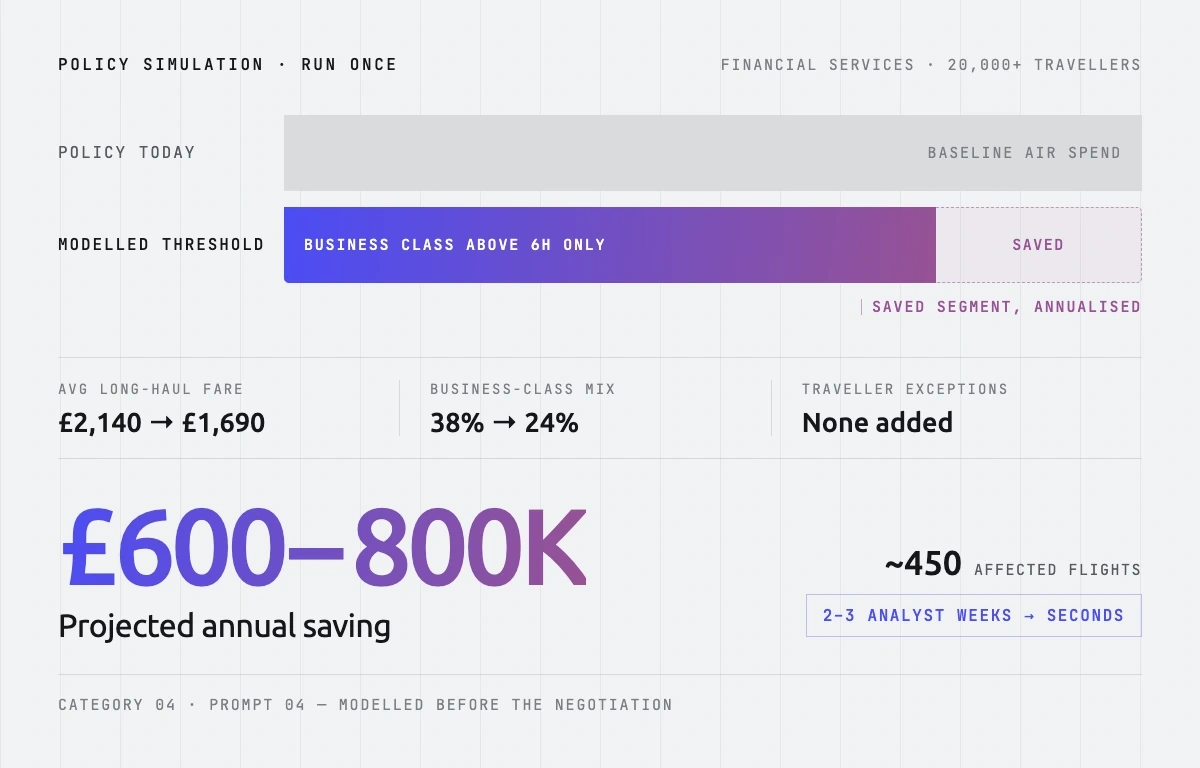
Live deployment · Category 04 · prompt 04
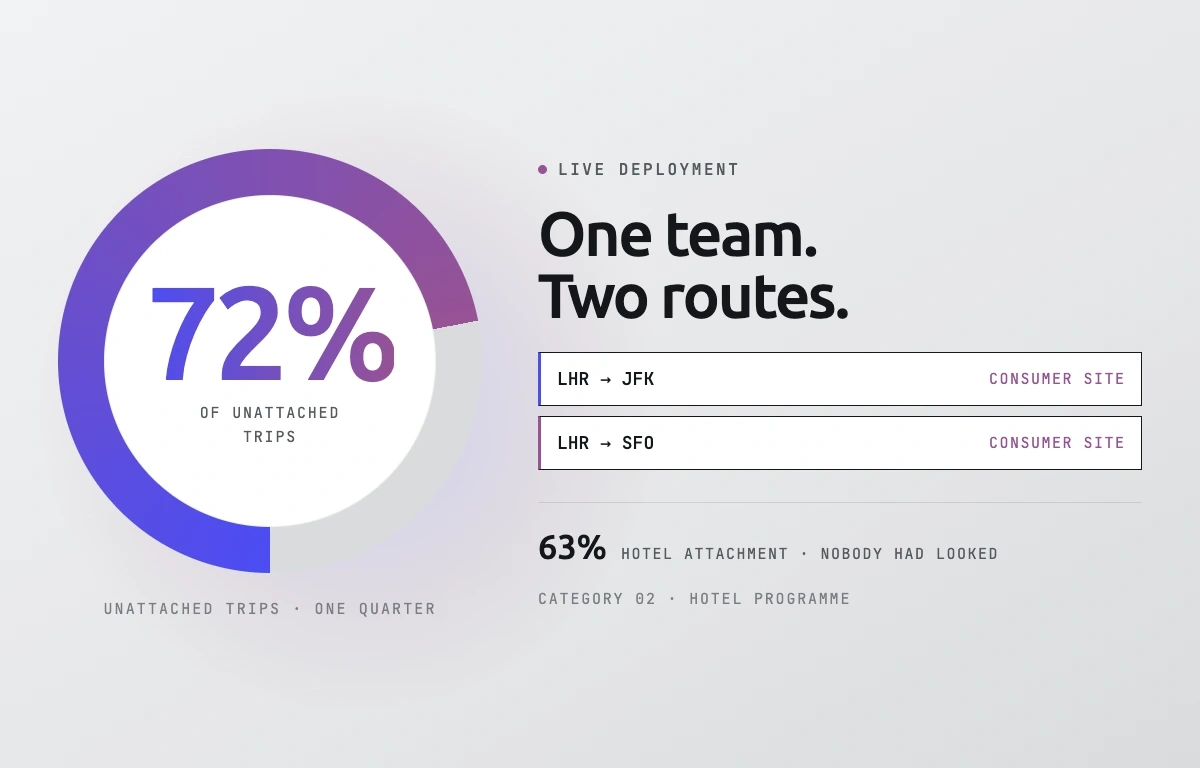
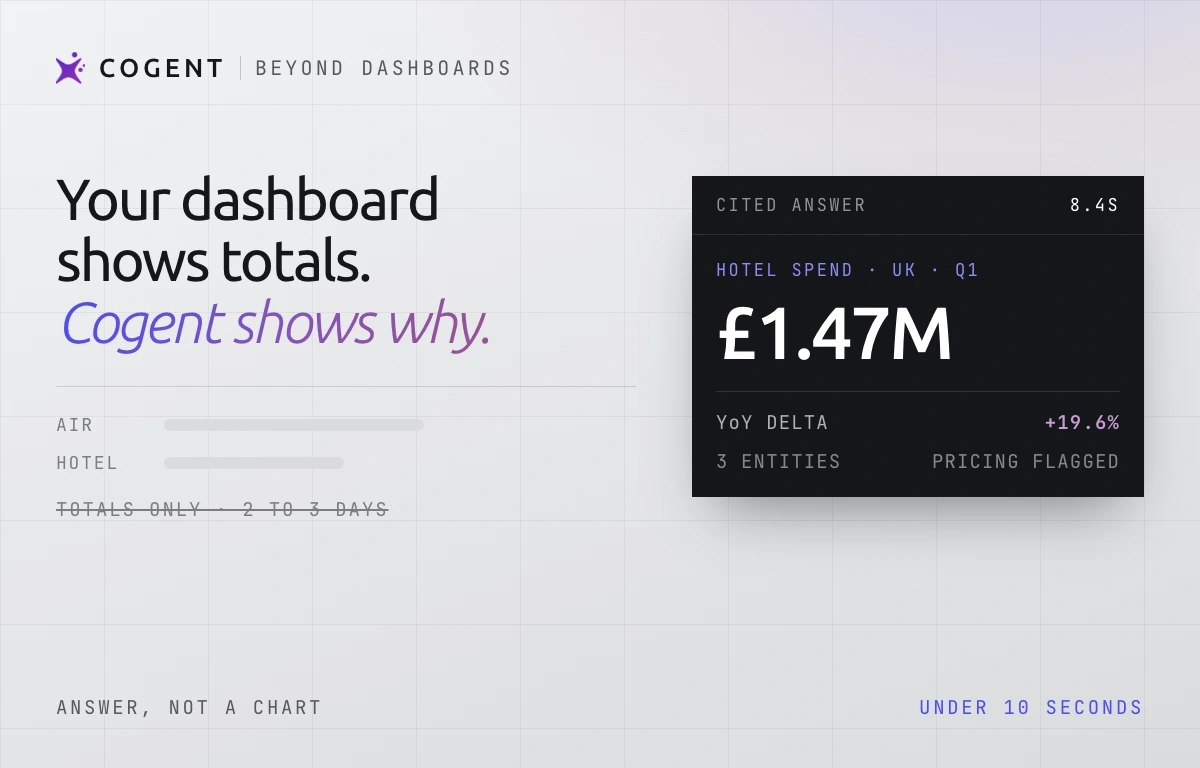
Live deployment · Category 02 · hotel programme
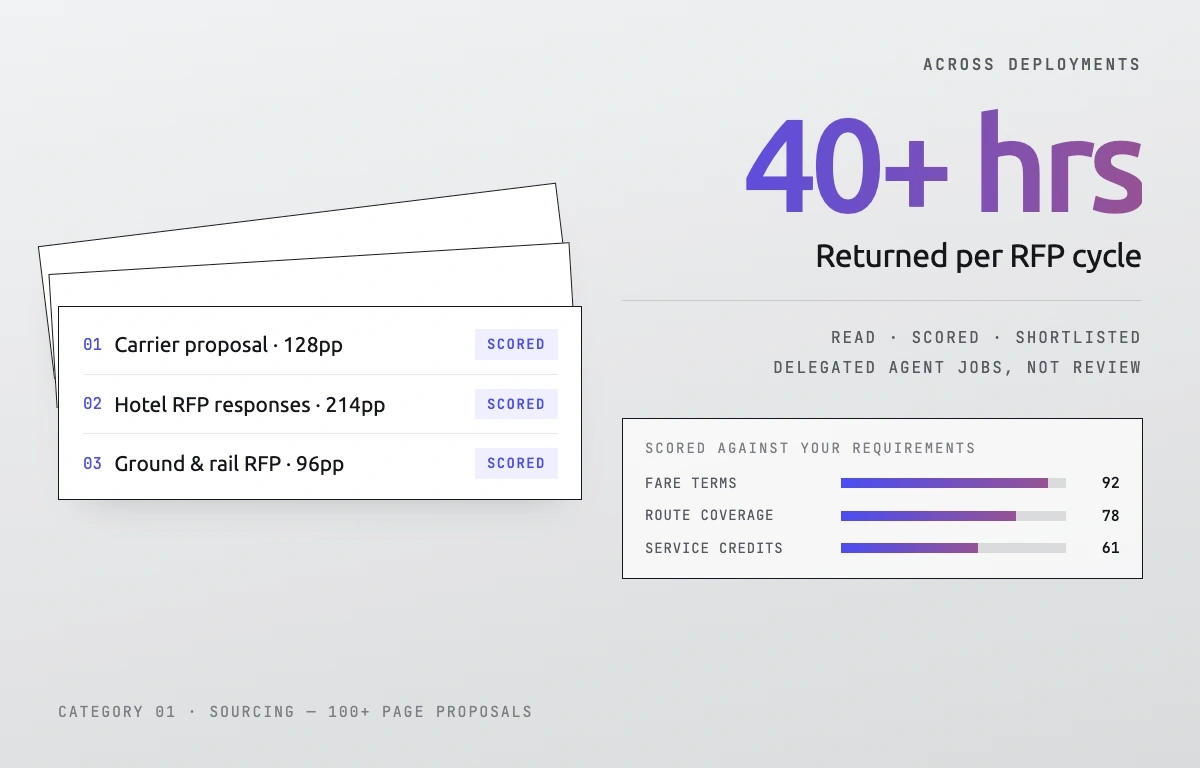
Across deployments · Category 01 · sourcing
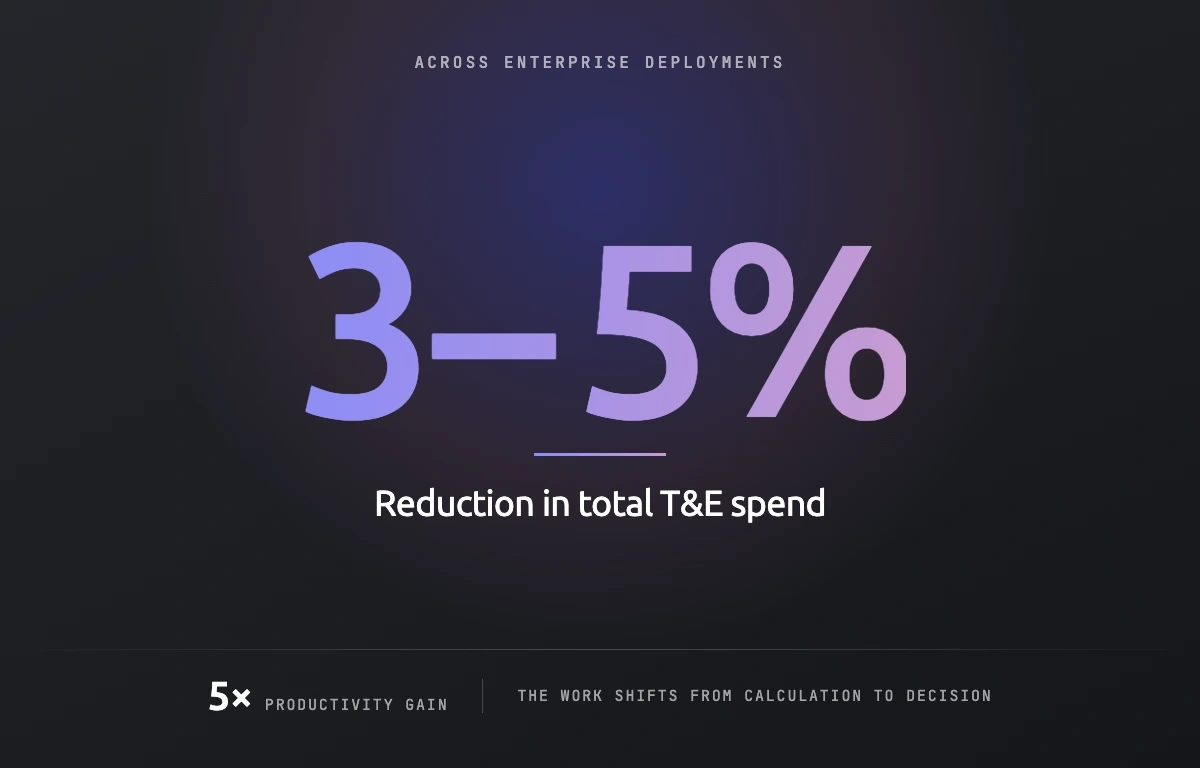
Across deployments · programme outcome
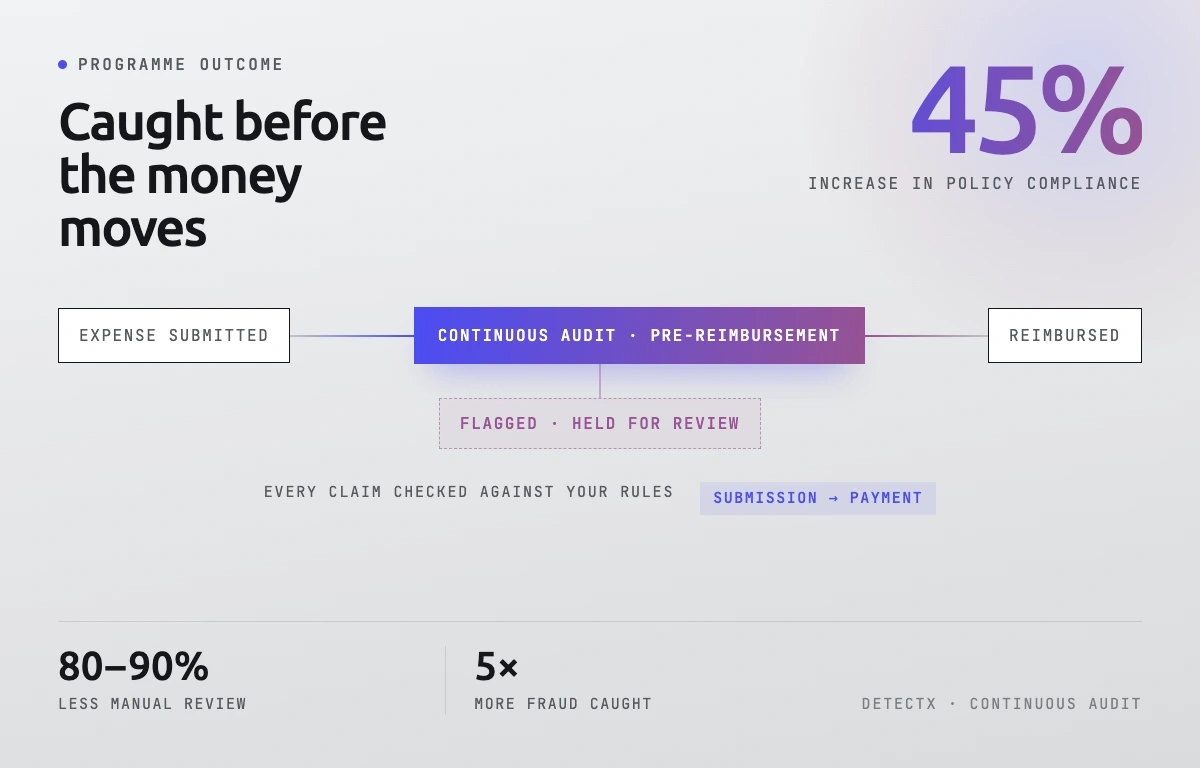
Across deployments · DetectX continuous audit
Weekly, monthly, quarterly, or triggered by new data. Orchestra keeps it arriving.
The gap between you and the answer is one copied brief.
Pick the three prompts your team could not answer this quarter. The live demo runs them on data shaped like yours, and you leave with the answers.
Plain language, no query syntax. Runs on the feeds you already have.
ISO 27001:2017 · PCI-DSS · Cyber Essentials · GDPR